Unlock the secrets of successful crypto trading with our top 5 must-have technical charts for navigating the market trends!
 Image courtesy of Jill Burrow via
 Table of Contents
Introduction to Crypto Charts
In this beginning part, we’ll talk about what technical analysis charts are and why they’re super helpful for people trading cryptocurrencies, especially if you’re just starting! If you’re new to trading or trying to figure out the best times to buy or sell, these charts are going to be your best friend. Let’s dive in!
Technical analysis charts are like magic windows that help us see patterns in the wild world of cryptocurrency trading. They are a bit like treasure maps that can guide us to where the hidden gems of profit might be. For beginners getting into the trading game, these charts are the compass that can point you in the right direction.
Whether you’re trying to understand market trends, find profitable trading signals, or simply looking for the best trading analytics platform to kickstart your journey, these technical analysis charts will be your trusty sidekick. They provide valuable insights and information that can make a big difference in your trading success. So, buckle up and get ready to explore the fascinating world of crypto charts!
The Basics of Technical Analysis
Let’s dig into the basics of technical analysis. You’ll learn how these cool tools help us see patterns in the market!
What is Technical Analysis?
Technical analysis is like looking at a crystal ball for the cryptocurrency market. By studying historical price movements, we can try to predict where prices might go next. It’s kind of like trying to figure out a puzzle using clues from the past!
Why Use Technical Analysis?
Using technical analysis charts can help us make smarter decisions when trading cryptocurrencies. These charts give us insights into trends, patterns, and potential price movements. By using these tools, we can find the best times to buy or sell, helping us maximize profits and minimize risks.
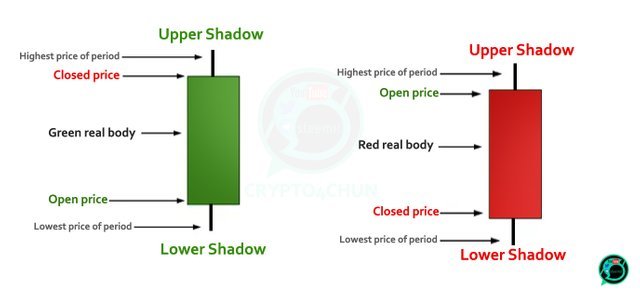
Chart #1: The Candlestick Chart
candlestick charts are a type of real-time market analysis tool designed especially for day traders. These charts, with their candle-like shapes, provide a visual representation of price movements over time, offering valuable insights into the market’s current state.
Image courtesy of steemit.com via Google Images
Understanding Candlesticks
Each candle on a candlestick chart represents a specific time period, such as a day, and consists of a body and wicks. The color and length of the body, as well as the size of the wicks, convey vital information about the opening, closing, high, and low prices within that period.
The color of the candlestick body, whether it is green or red, indicates whether the price of the cryptocurrency increased or decreased during that time frame. A green (or white) candle shows that the closing price was higher than the opening price, signaling a price rise. Conversely, a red (or black) candle signifies that the closing price was lower than the opening price, indicating a price drop.
Additionally, the length of the body reveals the range between the opening and closing prices, whereas the wicks represent the highest and lowest prices reached during the specified time period. By analyzing these elements collectively, traders can gain valuable insights into market trends, price momentum, and potential price reversals.
Chart #2: The Line Chart
Line charts are super simple: they just draw a line from one price to the next. We’ll see why they are a great way to start!
The Bar Chart
When it comes to understanding cryptocurrency trading, bar charts are a great tool that gives us a more detailed view of how prices move. These charts use bars that go up and down to show us the highest and lowest prices reached during a specific period.
 Image courtesy of in.pinterest.com via Google Images
How Bar Charts Work
Each vertical line in a bar chart represents the price range for a set time, like an hour, a day, or a week. The top of the bar shows the highest price traded, while the bottom indicates the lowest price. Additionally, little dashes on the sides of each bar represent the opening and closing prices for that period.
By looking at bar charts, traders can quickly see the price range, as well as the opening and closing values. This information is essential for making decisions about buying or selling cryptocurrencies.
Comparing Bar Charts to Other Charts
Bar charts offer more details than line charts, since they show not only the closing price but also the high and low points. This extra data can be very useful for tracking trends and making predictions about where prices might be headed next.
Compared to candlestick charts, bar charts may seem a bit simpler, but they still provide valuable insights into price movements. Some traders prefer bar charts for their straightforward presentation of price information.
Understanding how to read and interpret bar charts can give traders an edge in the cryptocurrency market, allowing them to make more informed decisions based on a comprehensive view of price movements.
The Point and Figure Chart
Point and Figure charts are a unique type of chart used by traders to track price movements in the market. Unlike other charts that show every tiny price change, Point and Figure charts only focus on significant price movements, making them a preferred choice for some traders.
How Point and Figure Charts Work
In a Point and Figure chart, columns of X’s and O’s represent price changes. X’s indicate rising prices, while O’s represent falling prices. When the price moves a set amount, a new X or O is added to the chart, creating a pattern that helps traders identify trends.
Why Traders Love Point and Figure Charts
Traders appreciate Point and Figure charts for their simplicity and clarity in showing price movements. These charts filter out the noise of minor price fluctuations and focus on significant price changes, helping traders make informed decisions based on trends.
By using Point and Figure charts, traders can quickly identify support and resistance levels, trend reversals, and potential breakout points. This straightforward approach to analyzing price movements can provide valuable insights into market trends and help traders spot profitable opportunities.
The Market Depth Chart
Market Depth charts are an excellent tool for traders looking to make profitable decisions. These charts provide valuable insights into the supply and demand dynamics of a particular cryptocurrency, helping traders gauge market sentiment and potential price movements.
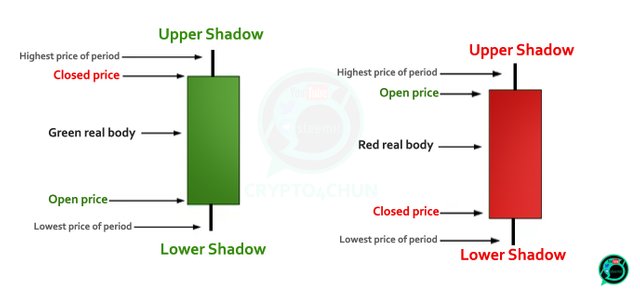 Image courtesy of steemit.com via Google Images
Understanding Market Depth Charts
Market Depth charts display the cumulative buy and sell orders at various price levels for a specific cryptocurrency. The buy orders are typically represented on the left side of the chart, while the sell orders are shown on the right. By visualizing the level of demand (buy orders) and supply (sell orders) at different price points, traders can assess potential areas of support and resistance.
For example, if there is a significant amount of buy orders at a particular price level, it may indicate strong buying interest and potential price support. Conversely, a cluster of sell orders at a specific price point could suggest resistance levels where selling pressure may increase.
Using Market Depth Charts for Trading
Traders can leverage Market Depth charts to make informed trading decisions. By analyzing the order book data, traders can identify potential entry and exit points for their trades. For instance, if there is a large buy wall (many buy orders at a certain price) on the chart, it could signal a good buying opportunity as other traders are willing to purchase at that level.
| Chart Type | Description | Benefits |
|---|---|---|
| Candlestick Chart | Shows price movements over a specific period of time in the form of candlesticks. | Provides visual representation of price trends and patterns for analysis. |
| Line Chart | Displays closing prices of a cryptocurrency over time in a simple line format. | Easy to read and understand for beginners and gives a quick overview of price movement. |
| Relative Strength Index (RSI) Chart | Indicates overbought or oversold conditions of a cryptocurrency based on its recent price movements. | Helps traders identify potential trend reversals and make informed decisions. |
| Moving Average (MA) Chart | Calculates the average price of a cryptocurrency over a specified period of time. | Smoothens out price fluctuations to identify trends and possible entry/exit points. |
| Bollinger Bands Chart | Consists of a simple moving average with upper and lower bands that represent volatility levels. | Helps traders measure price volatility and identify potential trading opportunities. |
On the other hand, if there is a substantial sell wall (many sell orders at a specific price), it may indicate a potential obstacle for price movement, suggesting a looming resistance level. By interpreting these signals, traders can adjust their trading strategies accordingly to capitalize on market movements.
How to Choose the Right Chart for You
When it comes to trading cryptocurrencies, choosing the right chart is crucial. If you’re new to the world of trading and technical analysis, it can be overwhelming to decide which chart to use. Let’s explore some tips on how to pick the best chart for your needs.
Consider Your Skill Level
If you’re just starting out as a trader, it’s essential to choose a chart that is easy to understand. Opt for charts with simple visuals and straightforward indicators. As a beginner, you may find line charts or basic candlestick charts more user-friendly than complex chart types.
Define Your Trading Goals
Before selecting a chart, think about your trading objectives. Are you looking to make quick trades based on real-time data, or do you prefer a more long-term investment approach? Different chart types cater to various trading styles, so align your choice with your goals.
Match the Chart to Your Strategy
Each chart offers unique insights into the market, making some charts more suitable for specific trading strategies. If you’re a day trader seeking quick market analysis, a real-time candlestick chart may be ideal. For long-term investors interested in market trends, a point and figure chart could be a better fit.
Utilize Beginner-Friendly Platforms
As a novice trader, consider using platforms specifically designed for beginners. These platforms often offer user-friendly charting tools and resources to help you understand and interpret market data effectively. Look for trading analytics platforms that provide educational materials and guidance for new traders.
By taking into account your skill level, trading goals, preferred strategy, and utilizing beginner-friendly platforms, you can choose the right chart that best suits your needs as a cryptocurrency trader. Remember, practice and experimentation are key to improving your chart analysis skills over time.
Using Charts for Algorithmic Trading
Algorithmic trading is a fancy term that means using computer programs to make trades for you. These programs can analyze lots of information really quickly and help you decide when to buy or sell. And guess what? Those cool charts we’ve been talking about can play a big role in algorithmic trading!
 Image courtesy of get.investors.com via Google Images
How Charts Help in Algorithmic Trading
Imagine having to keep an eye on the prices of different cryptocurrencies all day long. It would be super tiring! But with algorithmic trading, you can set up programs to do this work for you. These programs can use the information from technical analysis charts to make smart decisions about buying or selling without you having to watch the market constantly.
By using the data from these charts, the algorithm can spot patterns and trends that might not be immediately obvious to us. This can help it make predictions about where prices might be headed. For example, if a certain chart pattern has historically led to an increase in price, the algorithm can be programmed to act accordingly when that pattern appears again.
Additionally, charts can also help the algorithm set limits on trades. For instance, if a chart shows that a certain cryptocurrency is likely to reach a certain price point, the algorithm can automatically make a trade when that price is reached, saving you the trouble of having to monitor it yourself.
Overall, using charts for algorithmic trading can help take a lot of the guesswork out of trading. By relying on data and patterns, these programs can make faster and more informed decisions than we might be able to on our own, potentially leading to more successful trades.
Practice Makes Perfect
Now that we’ve covered the different types of technical analysis charts and how they can help you make smart trading decisions in the cryptocurrency market, it’s time to talk about how practice is key to mastering these tools.
Getting Started with Practice
Learning how to read and interpret technical analysis charts may seem overwhelming at first, but like any skill, practice makes perfect. Start by familiarizing yourself with the different chart types we discussed earlier, such as candlestick charts, line charts, bar charts, point and figure charts, and market depth charts.
Practice Makes Progress
As you spend more time analyzing these charts and observing price movements, you’ll begin to notice patterns and trends that can guide your trading decisions. Remember, becoming proficient in reading technical analysis charts takes time and dedication, so be patient with yourself as you hone your skills.
Utilizing Demo Accounts
One great way to practice using technical analysis charts without risking real money is by utilizing demo trading accounts offered by many cryptocurrency exchanges. These accounts allow you to trade with virtual currency and test out different charting strategies in a simulated market environment.
Seeking Guidance
If you’re feeling stuck or overwhelmed while practicing with technical analysis charts, don’t be afraid to seek guidance from experienced traders or educational resources. Joining online trading communities or taking courses on chart analysis can provide valuable insights and tips to help you improve your skills.
Remember, the more you practice using technical analysis charts, the more confident and successful you’ll become as a cryptocurrency trader. So keep practicing, stay curious, and watch your trading skills grow!
Conclusion
After exploring the world of crypto technical charts, we’ve uncovered a treasure trove of valuable information that can help you make smarter trading decisions. From understanding the basics of technical analysis to diving into the various types of charts available, you now have a solid foundation to begin your journey as a savvy crypto trader.
 Image courtesy of www.statista.com via Google Images
By utilizing these tools, such as the candlestick chart for real-time market analysis or the market depth chart for profitable trading signals, you can gain insights into market trends and potential trading opportunities. Whether you’re a beginner looking for the best trading analytics platform or an experienced trader interested in algorithmic trading automation solutions, there’s a chart out there to suit your needs.
Remember, practice makes perfect! Taking the time to familiarize yourself with these charts and honing your skills in interpreting them will undoubtedly set you on the path to success in the crypto trading world. So don’t be afraid to dive in, experiment, and continue learning as you navigate the exciting and dynamic landscape of cryptocurrency trading.
Now armed with this newfound knowledge, you’re equipped to make informed decisions and embark on your trading journey with confidence. So go ahead, start exploring the world of crypto technical charts, and watch as your trading endeavors soar to new heights!
5 Must-Have Crypto Technical Charts
FAQs
What is cryptocurrency?
You’ll get a quick explanation about what cryptocurrency is and why it’s like having money on the internet.
Why are there different kinds of charts?
We’ll find out why not all charts are the same and how each type helps in different ways.
Can charts predict the future prices for sure?
Here, you’ll learn whether charts can always tell us what will happen with prices or if there’s a bit of guessing involved.
Every day 87,122 people use this Bizarre “Tap Water Ritual” To Rapidly Dissolve Fat
Are You Struggling to Lose Weight, See this Simple Solution!