Table of Contents
Support & Resistance Trading: The Only Strategy You Need
Are you one of those traders who have placed a trade at support only to see price break through, or entered at resistance expecting a reversal but got stopped out? If so, this blog post is for you. In this step-by-step guide, we will help you trade support and resistance like a professional, focusing on the right way to identify strong support & resistance zones, avoiding weak levels, and using the Break & Retest Strategy for high-probability trades.
Identifying Strong Support & Resistance Zones
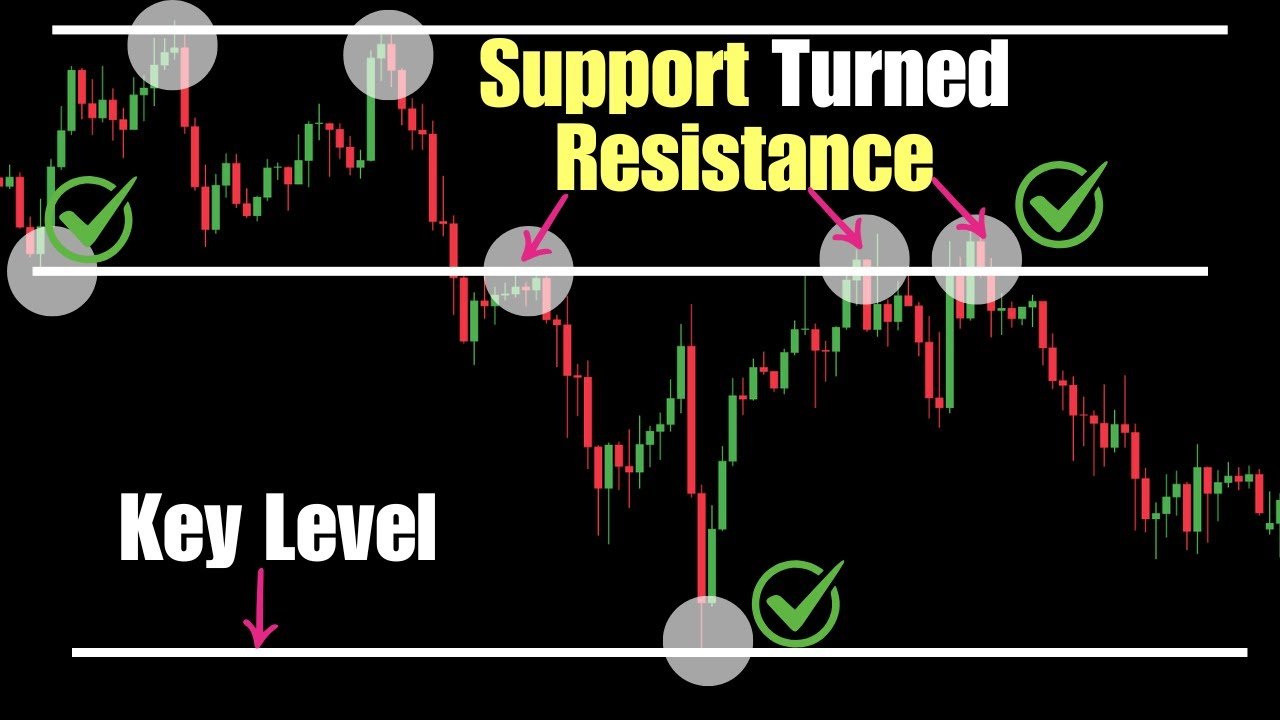
The first key point in support and resistance trading is to identify strong zones accurately. Many traders make the mistake of focusing on a single price level instead of a price range. Support and resistance are not exact prices but are price zones. To identify strong support and resistance zones, look for consecutive price touches that form a clear price range.

In the image above, we can see an example of a strong support zone. Price has touched the area three times, forming a clear price range. When price returns to this zone, it is more likely to respect this area and reverse.
Avoiding Weak Levels
Another common mistake traders make is focusing on weak support and resistance levels that most traders fall for. These levels are often psychological round numbers, like 1.2000 or 1.5000, where many orders accumulate, causing a quick breakthrough.
To avoid these weak levels, focus on significant support and resistance levels where price has spent more time, as these levels have higher odds of holding. These levels can be found using trendlines, Fibonacci retracement levels, or pivot points.
The Break & Retest Strategy
Once you have identified a strong support or resistance zone, the next step is to use the Break & Retest Strategy. This strategy is based on the idea that when price breaks through a strong support or resistance zone, it will often retest this level before continuing its move.

In the image above, we can see an example of the Break & Retest Strategy. Price breaks through the support zone, retraces back to the zone, and then continues its move downwards. By waiting for the retest, you can enter the trade with a higher probability of success.
Price Action Confirmation
The final key point in support and resistance trading is price action confirmation. Price action refers to the behavior of price as it moves up and down, and it can provide valuable information about the strength of a support or resistance level.
When price approaches a support or resistance level, look for bullish or bearish price action patterns. For example, bullish patterns like hammer or bullish engulfing patterns can indicate that price may reverse and respect the support level. Similarly, bearish patterns like shooting star or bearish engulfing patterns can indicate that price may reverse and respect the resistance level.

In the image above, we can see an example of price action confirmation. Price approaches the resistance level and forms a bearish engulfing pattern, indicating that price may reverse and respect the resistance level.
Practical Examples and Applications
Let’s look at a real-world example to see how these concepts can be applied.

In the chart above, we can see an example of using support and resistance trading in the EUR/USD currency pair. We first identify a strong support zone (1.1950-1.1975) where price has touched the area three times. We then wait for price to break through this zone and retest it using the Break & Retest Strategy.
As price approaches the support zone, we look for bullish price action patterns. In this case, we can see a bullish hammer pattern, which indicates that price may reverse and respect the support level. We then enter a long position at the retest of the support zone, using a stop loss below the support zone and a take profit at the next resistance level (1.2100).
Conclusion
Support and resistance trading is a powerful strategy that can help traders identify high-probability trades. By focusing on strong support and resistance zones, avoiding weak levels, using the Break & Retest Strategy, and using price action confirmation, traders can increase their chances of success.
Remember, trading involves a high level of risk, and past performance does not guarantee future results. Always consult with a professional financial advisor before making any investment decisions.
Thanks for reading! If you found this blog post helpful, please share it with your friends and subscribe to our channel for more trading tips and strategies.
Related Topics Covered:
* Learn Technical Analysis in 20 Minutes – The Ultimate Beginner’s Guide! * ONE Candle Scalping Strategy – Win Big in Forex, Stocks & Crypto! * PROVEN 1-Minute Scalping Strategy for MAXIMUM Profit!