Description
How to Trade with Supertrend and MACD Indicators
Trading in the forex market can be challenging but highly rewarding when approached with the right strategies and tools. Two popular indicators among traders are the Supertrend and the MACD (Moving Average Convergence Divergence). In this blog post, we’ll explore how to effectively use these indicators to enhance your trading strategy.
Understanding Supertrend and MACD
What is the Supertrend Indicator?
The Supertrend is a trend-following indicator that uses price action and volatility to determine the direction of the trend. It is plotted on the price chart, making it easy to identify bullish and bearish trends. The Supertrend indicator turns green in an uptrend and red in a downtrend.
Download Supertrend and MACD indicators Here
What is the MACD Indicator?
The MACD is a momentum indicator that shows the relationship between two moving averages of a security’s price. It consists of three components:
- MACD Line: The difference between the 12-day and 26-day exponential moving averages (EMAs).
- Signal Line: A 9-day EMA of the MACD line.
- Histogram: The difference between the MACD line and the signal line.
How to Trade with Supertrend and MACD
Combining the Supertrend and MACD indicators can help you make more informed trading decisions by confirming trends and identifying potential entry and exit points.
Step-by-Step Guide
- Identify the Trend with Supertrend
- Add the Supertrend indicator to your chart.
- Look for a green Supertrend line for a bullish trend and a red Supertrend line for a bearish trend.
- Confirm with MACD
- Add the MACD indicator to the same chart.
- In a bullish trend (Supertrend is green), look for the MACD Histogram crossing above the zero line. This indicates strong upward momentum.
- In a bearish trend (Supertrend is red), look for the MACD Histogram crossing below the zero line. This indicates strong downward momentum.
- Entry Signals
- For long positions, enter when the Supertrend is green, and the MACD Histogram crosses above the zero line.
- For short positions, enter when the Supertrend is red, and the MACD Histogram crosses below the zero line.
- Exit Signals
- Consider exiting long positions when the MACD Histogram crosses below the zero line or when the Supertrend turns blue.
- Consider exiting short positions when the MACD Histogram crosses above the zero line or when the Supertrend turns red.
Download Supertrend and MACD indicators Here
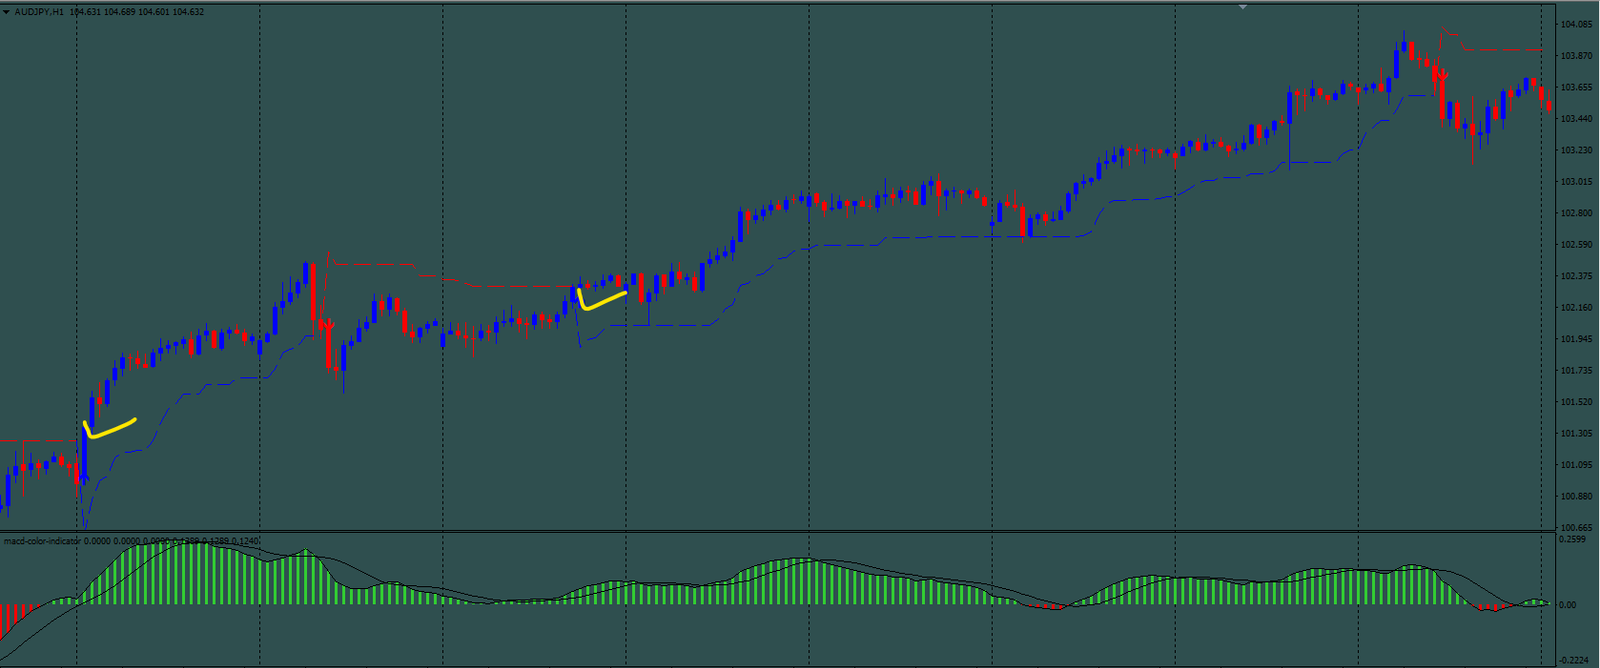
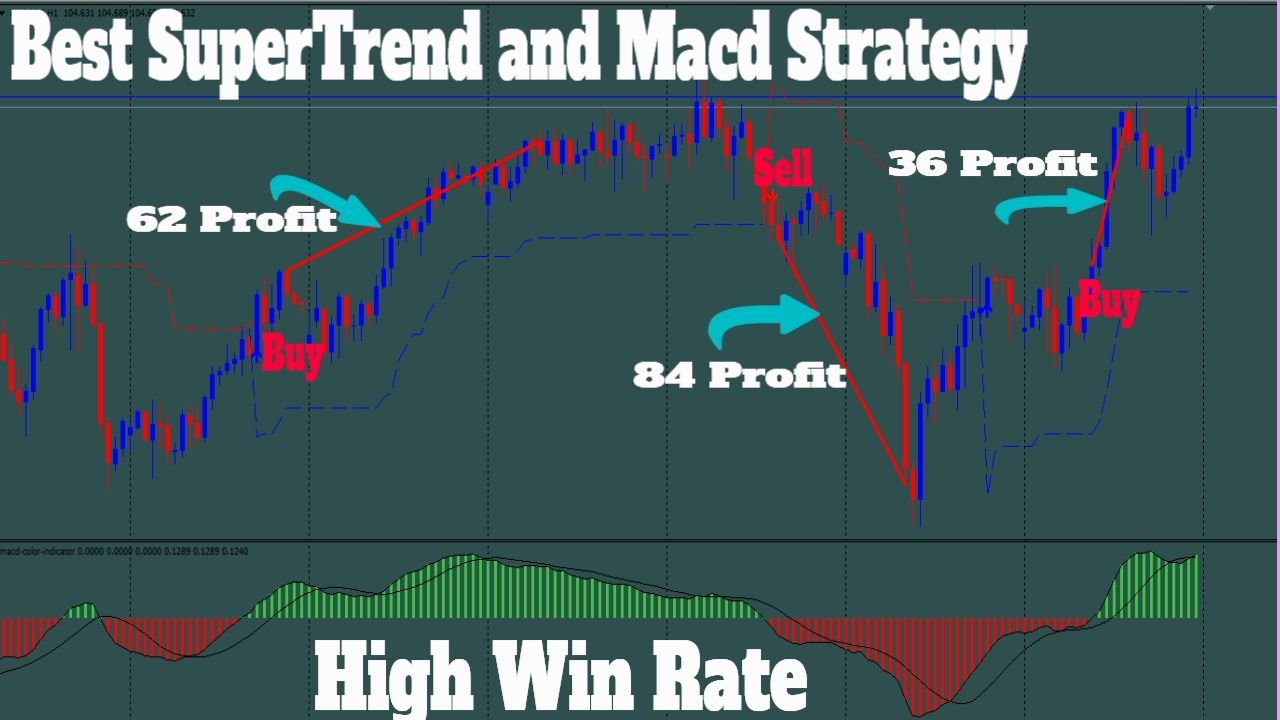
Example Trade
Let’s go through an example to see how these indicators work together.
Long Trade Example
- The Supertrend indicator turns blue, signaling a potential uptrend.
- The MACD Histogram crosses above the zero line, confirming upward momentum.
- Enter a long position.
- The trade continues as long as the Supertrend remains blue and the MACD Histogram stays above the zero line.
- Exit the position when the MACD Histogram crosses below the zero line or the Supertrend turns red.
Short Trade Example
- The Supertrend indicator turns red, signaling a potential downtrend.
- The MACD Histogram crosses below the zero line, confirming downward momentum.
- Enter a short position.
- The trade continues as long as the Supertrend remains red and the MACD Histogram stays below the zero line.
- Exit the position when the MACD Histogram crosses above the zero line or the Supertrend turns blue.
Conclusion
Trading with the Supertrend and MACD indicators can be a powerful combination. The Supertrend helps identify the direction of the trend, while the MACD confirms the strength and momentum of the trend. By using these indicators together, traders can improve their chances of making profitable trades.
Remember, no trading strategy is foolproof. Always use proper risk management techniques, such as setting stop-loss orders and not risking more than you can afford to lose. Happy trading!

Reviews
There are no reviews yet.