Description
Best MACD and Ichimoku 95% Winning Strategy for Beginners & Pro Traders
Forex trading can be both thrilling and challenging. Among the myriad of strategies, combining the Moving Average Convergence Divergence (MACD) with the Ichimoku Kinko Hyo offers a potent mix for identifying high-probability trades. This strategy is not just for seasoned professionals; beginners can also leverage its robustness. In this blog post, we’ll explore the best ways to combine these indicators, providing a step-by-step guide to potentially achieving a 95% winning strategy.
Understanding the Indicators
MACD
The MACD is a momentum oscillator that follows trends and shows the relationship between two moving averages of a security’s price. It comprises the MACD line, the signal line, and the histogram.
- MACD Line: Difference between the 12-day and 26-day Exponential Moving Averages (EMAs).
- Signal Line: 9-day EMA of the MACD line.
- Histogram: Difference between the MACD line and the signal line.
Ichimoku Kinko Hyo
Ichimoku is a comprehensive indicator providing more data points and deeper insight into potential price action. It consists of:
- Tenkan-sen (Conversion Line): (9-period high + 9-period low) / 2
- Kijun-sen (Base Line): (26-period high + 26-period low) / 2
- Senkou Span A (Leading Span A): (Tenkan-sen + Kijun-sen) / 2, plotted 26 periods ahead
- Senkou Span B (Leading Span B): (52-period high + 52-period low) / 2, plotted 26 periods ahead
- Chikou Span (Lagging Span): Close plotted 26 periods back
The area between Senkou Span A and B forms the Kumo (cloud), which identifies support and resistance levels.
Setting Up the Strategy
Step 1: Configure Your Charts
- Timeframe: This strategy works best on higher timeframes like the 4-hour and daily charts.
- MACD Settings: Use the default settings (12, 26, 9).
- Ichimoku Settings: Use the default settings (9, 26, 52).
Step 2: Identify Trade Setup
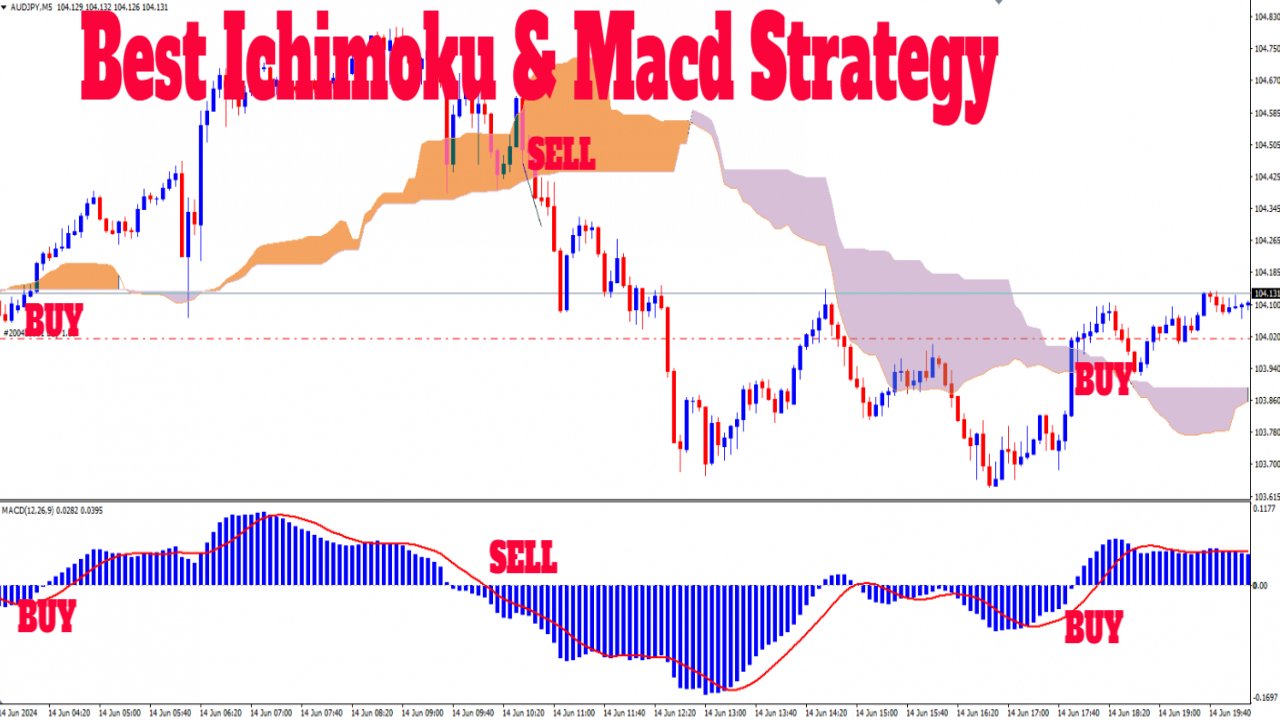
Buy Signal
- MACD: Look for the MACD line crossing above the signal line.
- Ichimoku: Ensure the price is above the Kumo cloud, indicating an uptrend.
Sell Signal
- MACD: Look for the MACD line crossing below the signal line.
- Ichimoku: Ensure the price is below the Kumo cloud, indicating a downtrend.
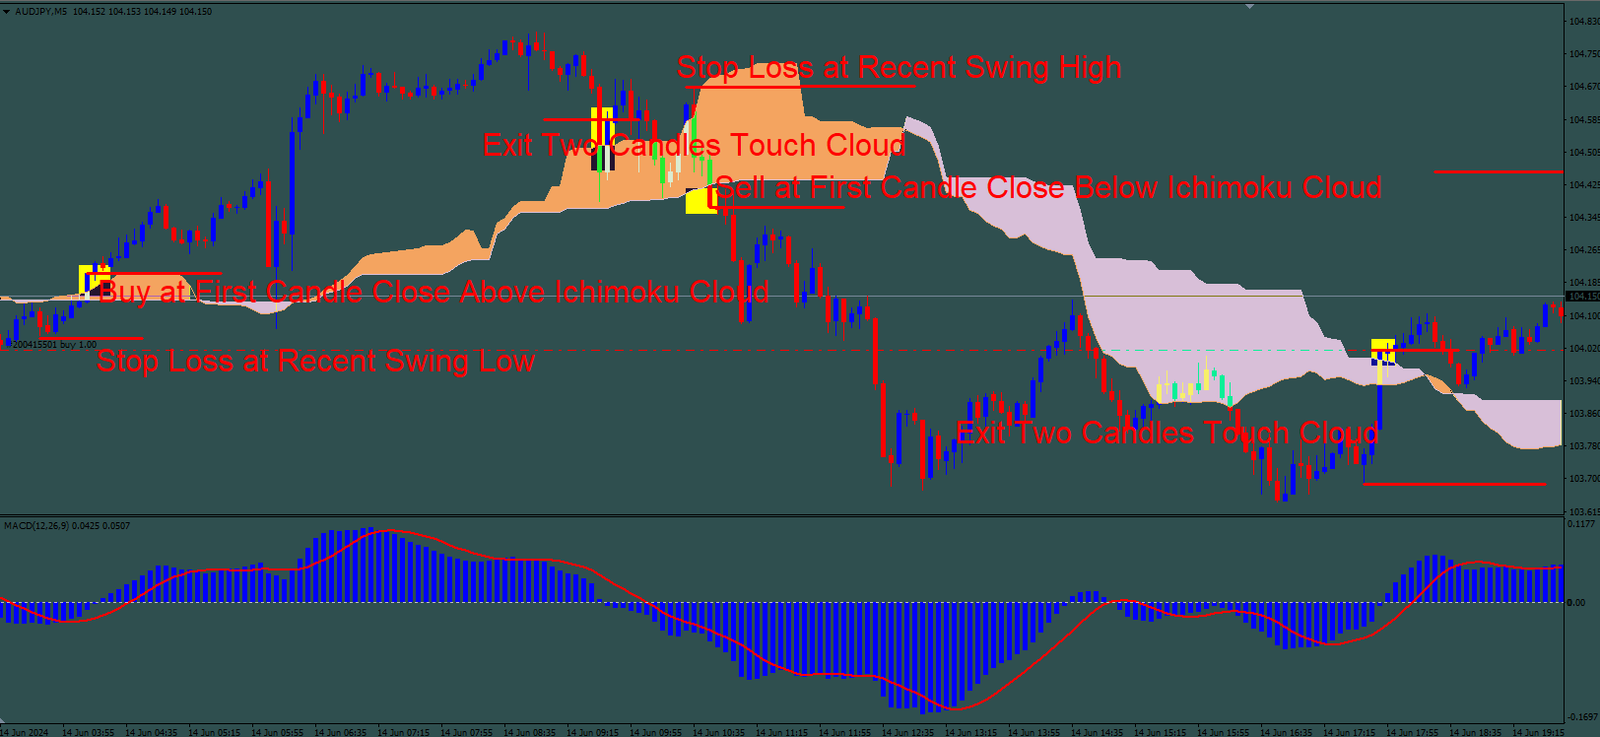
Step 3: Entry and Exit Points
Entry
- Buy Entry: When MACD generates a bullish crossover and the price is above the Kumo cloud.
- Sell Entry: When MACD generates a bearish crossover and the price is below the Kumo cloud.
Exit
- Take Profit: Set your take profit at the next key resistance level for buys and support level for sells.
- Stop Loss: Place your stop loss just below the Kumo cloud for buys and just above the Kumo cloud for sells.
Step 4: Risk Management
- Position Size: Risk no more than 2% of your account on any single trade.
- Risk-Reward Ratio: Aim for at least a 1:2 risk-reward ratio.
Example Trade
Buy Example
- Timeframe: 4-hour chart
- MACD: Bullish crossover
- Ichimoku: Price above Kumo cloud
Sell Example
- Timeframe: Daily chart
- MACD: Bearish crossover
- Ichimoku: Price below Kumo cloud
Conclusion
Combining the MACD with the Ichimoku Kinko Hyo indicator can significantly improve your trading accuracy. This strategy’s strength lies in its ability to filter out false signals and provide clear entry and exit points, making it ideal for both beginners and professional traders. As always, ensure to backtest this strategy on a demo account before applying it in a live trading environment.
Author: Pro Trading Mentor
Professional Forex Trader & Analyst
Keywords: MACD Ichimoku Strategy, Forex Trading Strategy, MACD Ichimoku 95% Winning Strategy, Beginner Forex Strategy, Pro Trader Strategy
Feel free to reach out in the comments below if you have any questions or need further clarification. Happy trading!


Reviews
There are no reviews yet.