Mastering Technical Analysis for Trading Success
Introduction to Technical Analysis
Technical analysis is a crucial skill for making informed trading decisions and achieving profitability in any market. As emphasized, “Your ability to use technical analysis in order to make good trading decisions and inevitably make money in any market is imperative.” This guide aims to equip you with the essential knowledge needed to master technical analysis, covering everything from understanding candlestick charts to utilizing indicators, identifying support and resistance levels, recognizing trends, and implementing entry patterns.
Throughout this video, you will gain insights from a decade of trading experience, all compiled into one comprehensive resource. Whether you’re struggling to make profits or looking to refine your skills, this guide will provide valuable information to enhance your trading strategy.

We encourage you to engage with the content, and if you find it helpful, consider supporting the channel by liking and subscribing for more weekly insights.
Understanding Candlestick Charts
“Technical analysis is the study of historic price movements in order to make accurate decisions of what the market may do next.”
Candlestick charts are a fundamental tool in technical analysis, used across various markets such as Forex, stocks, and cryptocurrencies. They provide a visual representation of price movements over a specified time frame, helping traders make informed decisions.
Definition of Candlestick Charts
A candlestick chart is a type of financial chart used to describe price movements of a security, derivative, or currency. Each “candlestick” typically shows one day, thus a one-month chart may show the 20 trading days as 20 candlesticks.
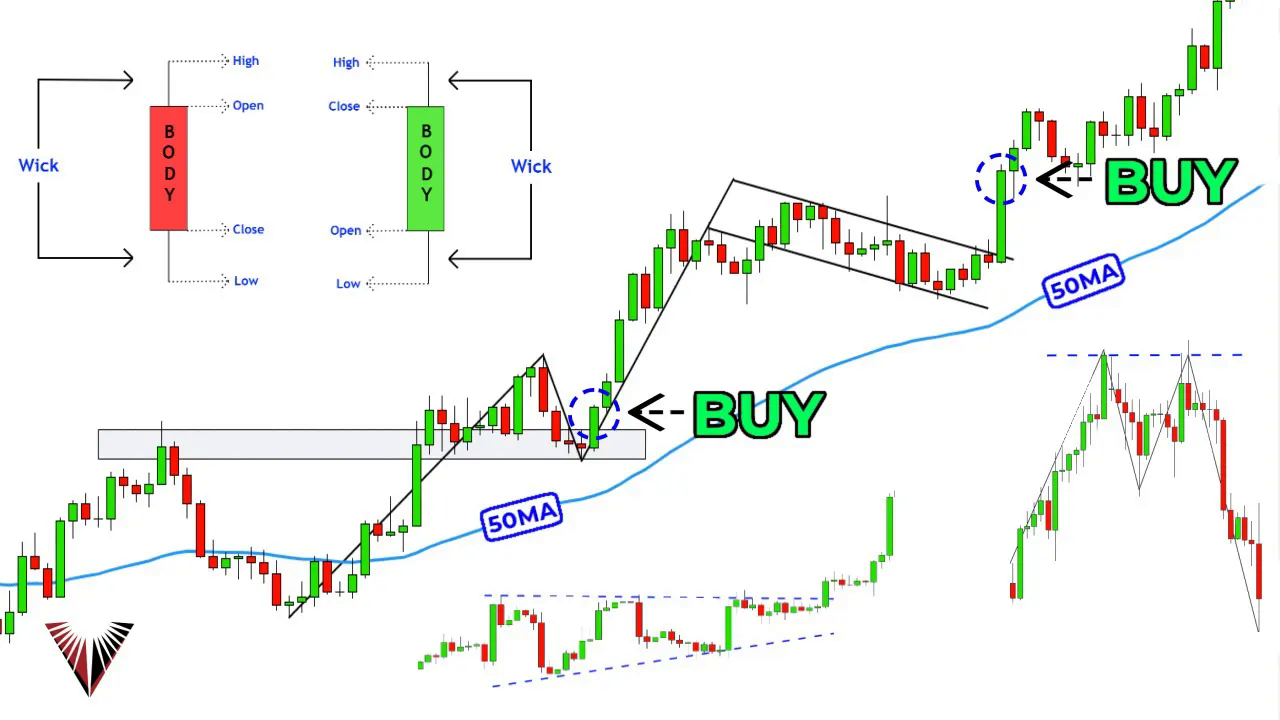
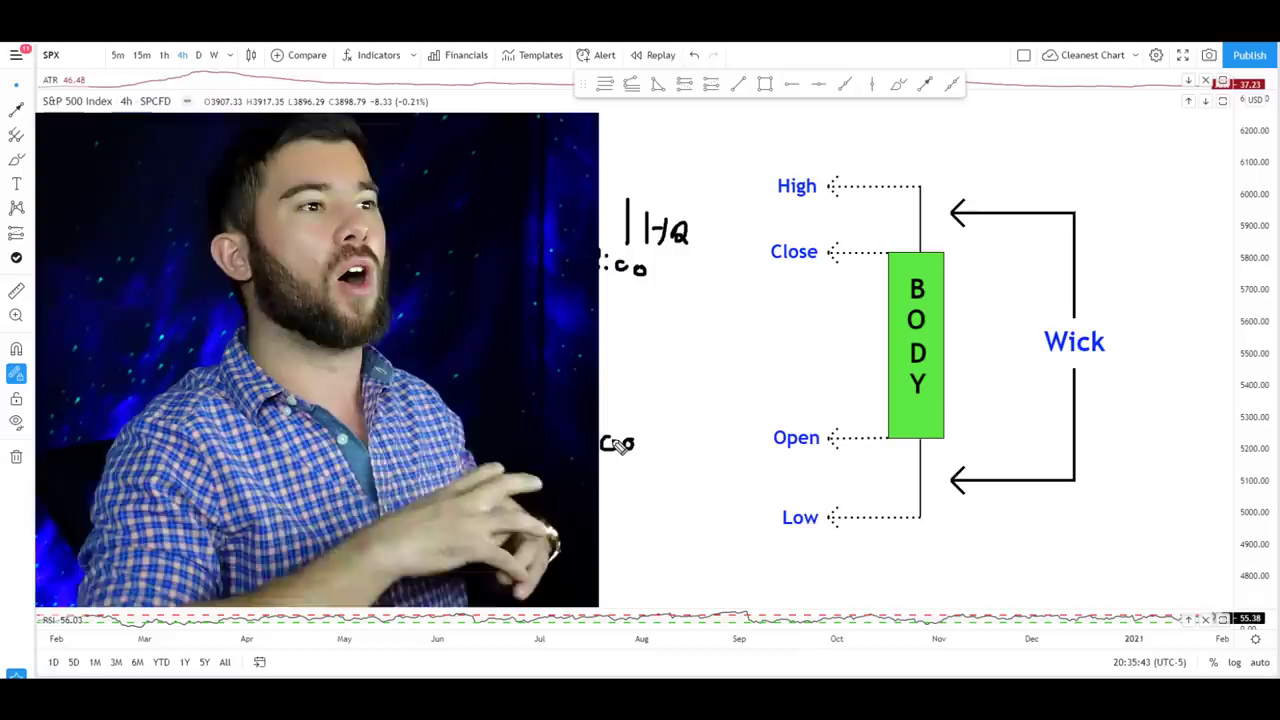
Explanation of Single Candlestick Components
Each candlestick consists of a body and wicks (or shadows). The body represents the range between the open and close prices, while the wicks indicate the high and low prices during the time frame.
- Open: The price at which the asset started trading during the time frame.
- High: The highest price reached during the time frame.
- Low: The lowest price reached during the time frame.
- Close: The price at which the asset finished trading during the time frame.
A green (or white) candlestick indicates that the closing price was higher than the opening price, suggesting a bullish trend. Conversely, a red (or black) candlestick indicates a bearish trend, where the closing price was lower than the opening price.
Importance of Time Frames in Candlestick Analysis
Time frames are crucial in candlestick analysis as they determine the duration each candlestick represents. For example, on a 5-minute chart, each candlestick represents 5 minutes of price movement. On a daily chart, each candlestick represents one day.
Understanding the time frame is essential for interpreting the candlestick’s information accurately. A trader might use different time frames to analyze short-term and long-term trends.
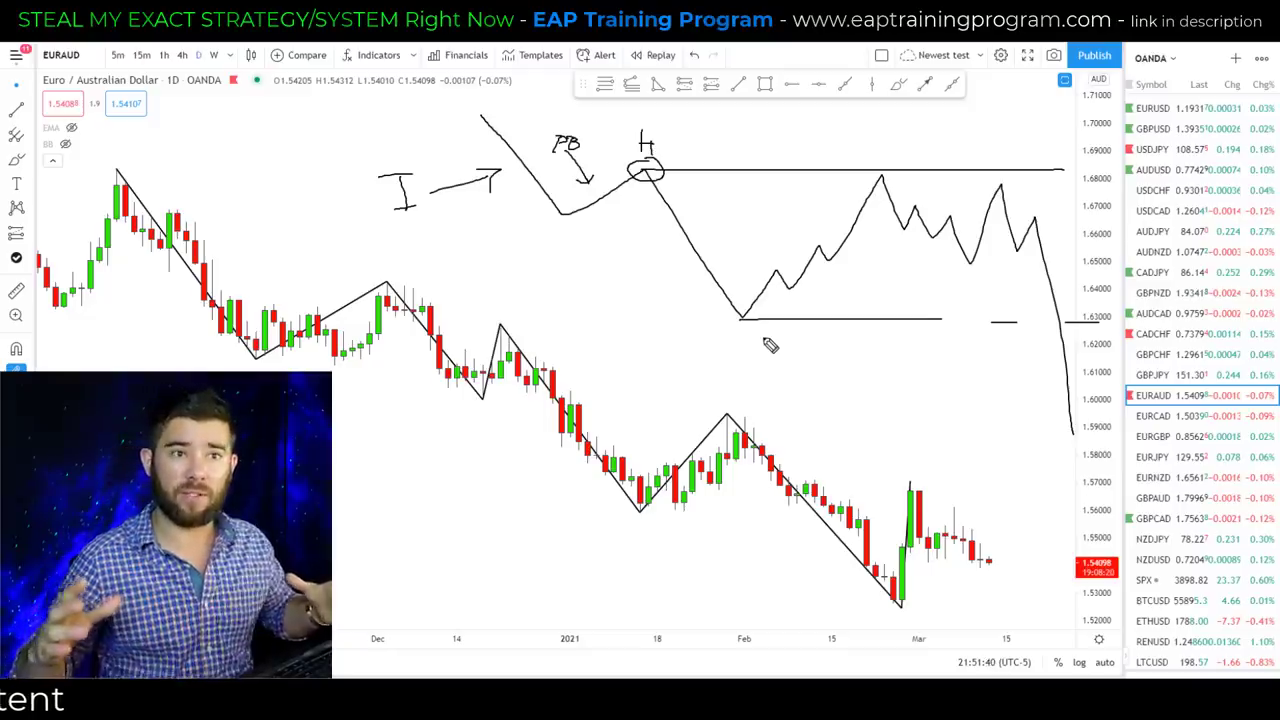
Identifying Trends
In technical analysis, identifying trends is crucial for making informed trading decisions. A trend is essentially the general direction in which a market is moving. Understanding how to identify and follow trends can significantly enhance trading accuracy and profitability.
Definition of Uptrends and Downtrends
An uptrend occurs when a candlestick chart consistently makes new highs and higher lows. This pattern indicates that the market is moving upwards, and traders often look to buy in such conditions. Conversely, a downtrend is characterized by lower highs and lower lows, suggesting a downward market movement, where selling might be more advantageous.
“An uptrend is nothing more than when a candlestick chart is consistently making new highs and higher lows.”
How to Identify Higher Highs and Higher Lows
To identify an uptrend, observe the candlestick chart for a series of higher highs and higher lows. These are marked by impulsive moves, which are significant price movements breaking into new highs, followed by pullbacks, where the market takes a breather. The key is to ensure that the lowest low of the pullback is not broken, maintaining the uptrend.
Importance of Trading with the Trend
Trading with the trend is often recommended because it aligns with the market’s natural direction, increasing the likelihood of successful trades. Following the trend can lead to better reward-to-risk setups and is generally easier than attempting to predict market reversals. In an uptrend, traders should focus on buying opportunities, while in a downtrend, selling might be more appropriate.
By understanding and applying these principles, traders can better navigate the markets and make more informed decisions.
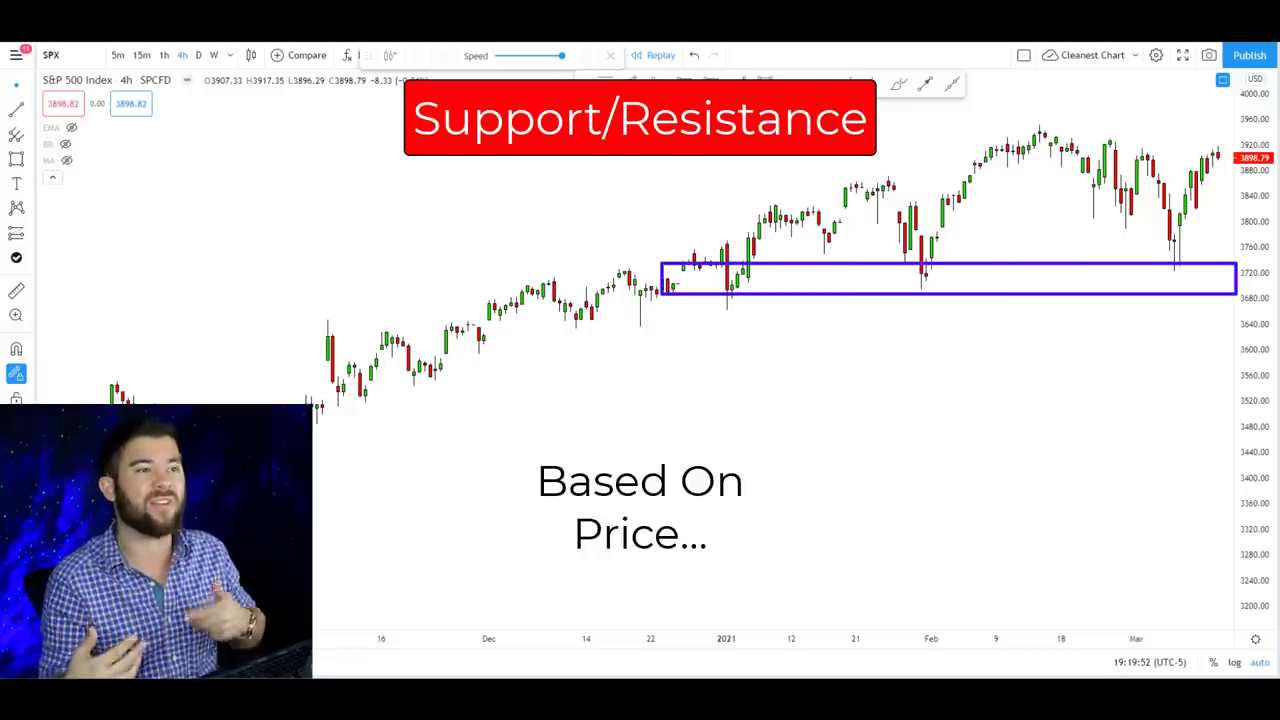
Support and Resistance Levels
Support and resistance levels are crucial concepts in technical analysis, helping traders identify potential areas where the price of an asset might react.
“Support is an area in the market that price is likely to have a bounce up from or be supported by whereas resistance is an area in the market where the price of an asset is likely to fall from.”
Definition of Support and Resistance
- Support: A price level where a downtrend can be expected to pause due to a concentration of demand.
- Resistance: A price level where an uptrend can be expected to pause due to a concentration of supply.
These levels are derived from historical price data and reflect the collective decisions of market participants.
How to Identify These Levels on Charts
- Historical Data: Look for areas where the price has repeatedly bounced off or reversed.
- Trend Lines: Draw lines connecting the highs and lows to visualize potential support and resistance.
- Break and Retest Strategy: Identify previous resistance levels that have been broken and may now act as support, and vice versa.
Using Support and Resistance for Entry and Exit Points
- Reversals: Spot potential reversals by identifying when the price approaches these levels.
- Trend Continuation: Use previous resistance as support in an uptrend, and previous support as resistance in a downtrend.
- Stops and Targets: Determine stop-loss and take-profit levels based on these key areas.
Practical Example
In an uptrend, a trader might look for the price to pull back to a previous resistance level that has turned into support. Conversely, in a downtrend, the price might pull back to a previous support level that has become resistance.
By understanding and applying these concepts, traders can make more informed decisions and improve their trading strategies.
Using Trading Indicators
Trading indicators are essential tools in technical analysis, designed to simplify the complexities of price movements on candlestick charts. As stated, “Trading indicators are formulas added to current and historic price to help simplify what price is doing.” They provide clarity on market conditions, help identify trends, and assist in determining entry and exit points, as well as stop-loss and target placements.
Overview of Trading Indicators
Indicators are mathematical equations that plot lines and histograms on your chart. They serve as objective tools in a trading strategy, offering consistency and clarity. With thousands of indicators available, traders are encouraged to explore and find those that best fit their trading style.
Explanation of the ATR Indicator
The Average True Range (ATR) is a crucial indicator used to measure market volatility. It calculates the average movement of price over the last 14 candles, providing insight into the typical price fluctuation. This is particularly useful for setting stop-loss levels that align with market volatility, preventing trades from being prematurely stopped out.
To use the ATR on platforms like TradingView, simply click on the indicator tab, type “ATR,” and select it from the built-ins. The ATR helps traders stay in line with the volatility of a specific currency pair or timeframe, ensuring that stop-loss levels are appropriate for the market conditions.
How to Use Moving Averages in Trading
Moving averages are another popular indicator, used to smooth out price data and identify trends. They can be simple (SMA) or exponential (EMA), with the latter giving more weight to recent prices. Moving averages help traders determine the overall direction of the market and potential support and resistance levels.
In summary, trading indicators like the ATR and moving averages are invaluable for making informed trading decisions. They help traders align their strategies with market conditions, enhancing the likelihood of success.
Candlestick Patterns for Trading
Candlestick patterns are essential tools in technical analysis, helping traders to spot reversals, understand market sentiment, and make informed trading decisions. In this section, we will explore some popular candlestick patterns and how to effectively use them in trading.
“Candlestick patterns can be used to help us spot reversals and provide clarity on market sentiment.”
Overview of Popular Candlestick Patterns
- Engulfing Pattern: This pattern is characterized by a larger candle body that completely engulfs the previous candle. A bullish engulfing pattern occurs when a green candle engulfs a red one, indicating potential upward momentum. Conversely, a bearish engulfing pattern involves a red candle engulfing a green one, suggesting downward pressure.
- Hammer and Shooting Star: These patterns are indicative of potential reversals. A hammer appears at the bottom of a downtrend, showing that buyers are gaining control. A shooting star, on the other hand, appears at the top of an uptrend, signaling potential selling pressure.
- 38.2% Candle: This unique pattern is identified using a Fibonacci retracement. The body of the candle must be above the 38.2% retracement level for a bullish signal, or below it for a bearish signal. This pattern helps in objectively identifying buying or selling pressure.
How to Identify and Use These Patterns in Trading
- 38.2% Candle: To identify this pattern, draw a Fibonacci retracement from the low to the high of the candle. If the candle body is above the 38.2% level, it indicates buying pressure; if below, it indicates selling pressure. This pattern is useful for spotting reversals or trend continuations.
- Engulfing Candle: Look for a candle that completely engulfs the previous one. This pattern is used to identify potential reversals and is effective in both bullish and bearish markets.
- Close Above/Below Candle: This pattern is identified when a candle closes above or below the previous candle’s high or low, respectively. It indicates strong buying or selling pressure and can be used to confirm trend direction.
Examples of Effective Candlestick Patterns
- 38.2% Candle Example: In an uptrend, if a 38.2% candle forms at a previous resistance level, it may indicate a continuation of the trend. Use a Fibonacci retracement to confirm the pattern and consider entering a trade with a stop-loss below the swing low.
- Engulfing Candle Example: In a downtrend, a bullish engulfing candle may signal a reversal. Ensure the green candle engulfs the red one completely to confirm the pattern.
- Close Above/Below Example: A close below candle in a downtrend can confirm selling pressure, while a close above candle in an uptrend can confirm buying pressure.

By understanding and applying these candlestick patterns, traders can enhance their ability to predict market movements and make more informed trading decisions.
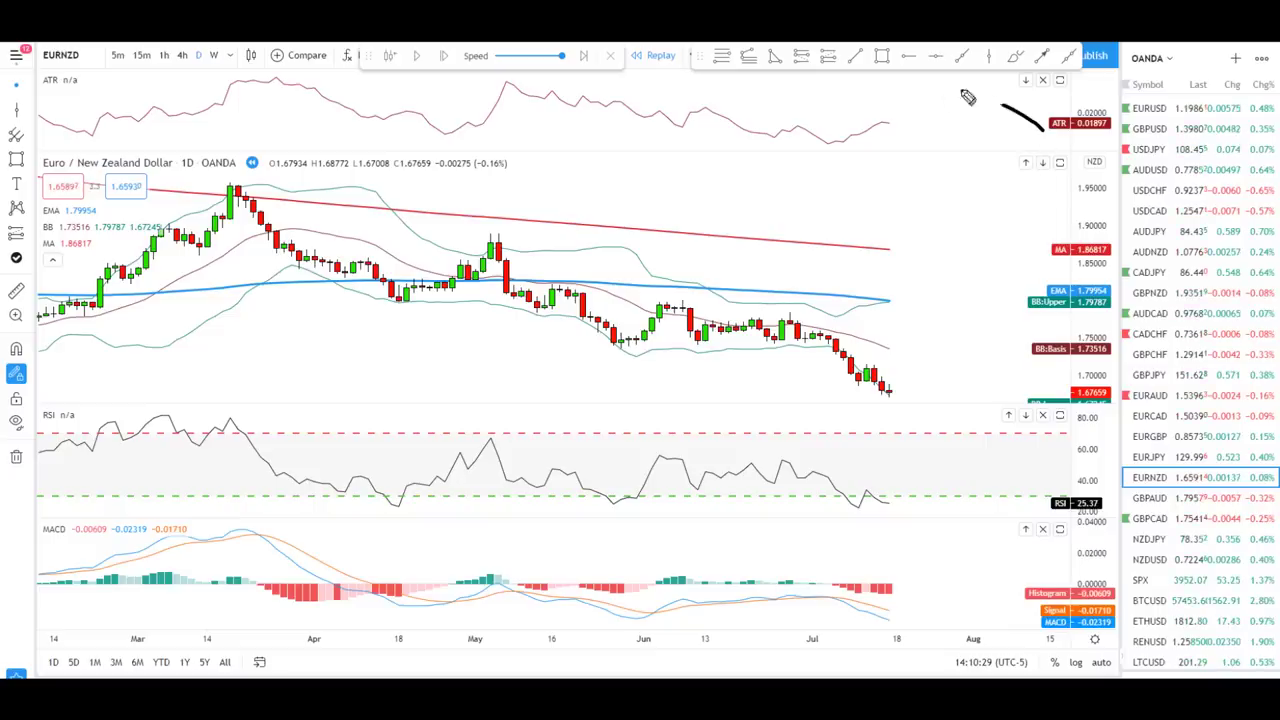
Chart Patterns and Breakouts
Chart patterns are essential tools in technical analysis, formed by 10 to 50 candles, and provide insights into market sentiment, potential reversals, and entry points. Unlike candlestick patterns, which are formed by fewer candles, chart patterns offer a broader view of market dynamics.
“Breakout patterns are when the market goes from a low period of volatility to a much higher period of volatility.”
Definition of Chart Patterns
Chart patterns are identifiable formations on a price chart that suggest future price movements. They are used to predict potential reversals or continuations in the market.
Explanation of Flag Patterns and Wedges
Flag Patterns: These occur during volatile trends, characterized by a sharp price movement followed by a period of consolidation. The pattern resembles a flag on a pole, with the pole being the initial price movement and the flag being the consolidation. Traders often enter trades when the price breaks out of the consolidation phase.
Wedges: These are formed when price movements become tighter over time, creating a wedge shape. An ascending wedge indicates rising support levels, while a descending wedge shows falling resistance levels. Breakouts from these patterns can signal strong price movements.
How to Trade Breakouts Effectively
- Identify the Pattern: Look for clear formations of double tops, double bottoms, flags, or wedges.
- Set Objective Rules: Define specific criteria for entering and exiting trades. For example, in a double bottom, wait for a break and close above the neckline before entering.
- Align with Higher Time Frames: Ensure that the pattern aligns with the trend on a higher time frame to increase accuracy.
- Use Moving Averages: For flag patterns, ensure the price is near or above the 20-period moving average to confirm a volatile trend.
- Manage Risk: Place stop-loss orders strategically, such as below the previous low for bullish flags, to manage risk effectively.
By understanding and applying these patterns, traders can make informed decisions and improve their trading strategies. For more on technical analysis, explore the Introduction to Technical Analysis section.
Conclusion and Next Steps
In this final section, we wrap up our exploration of technical analysis. Throughout this guide, we’ve covered essential topics such as candlestick charts, identifying trends, and using trading indicators. These foundational elements are crucial for developing a robust trading strategy.
“You now have everything you need to know about technical analysis.”
To move forward, it’s important to practice and apply the knowledge you’ve gained. Start by combining various technical factors to create your own strategy. Backtest this strategy and develop a risk management plan to support it. Additionally, focus on improving your trading psychology by demo trading until you achieve confidence and consistency.
For further learning, consider exploring resources on risk management and trading psychology. Platforms like YouTube offer a wealth of information that can enhance your understanding and application of these concepts.
[…] Best Trading Analytics Platform for Beginners […]