
Mastering a Simple and Effective Trading Strategy
In this article, we will explore an exciting trading strategy that is both simple and effective. This strategy utilizes a single indicator composed of three different algorithms, providing a comprehensive tool for analyzing market trends, directions, and momentum.
This versatile strategy is applicable to both indices and forex markets, making it a valuable addition to your trading toolkit. Whether you’re interested in swing trading on higher time frames or scalping, this strategy can be adapted to suit your needs.
Stay tuned as we delve into the details of this powerful trading approach, and don’t forget to like, comment, and subscribe to support the channel and help us tailor future content to your needs.
Setting Up the Indicator
To add the trading indicator to your chart, follow these steps:
- Locate the Link: The link for the indicator is provided in the description box below the video. Copy this link.
- Load the Indicator: Paste the copied link into your browser. This will load the indicator page.
- Add to TradingView: On the indicator page, you will see an option to add it to your chart. Click on this option to integrate the indicator into your TradingView account.
- Access the Indicator: In your TradingView account, click on the “Indicator” button. You will find the newly added indicator listed there. Click on it to add it to your chart.
“Once, this indicator you might be wondering how you add it to your chart, just follow, the steps below to add it to your chart.”
- Understanding the Components: After adding the indicator, familiarize yourself with its components to effectively use it in your trading strategy.
Continue to the next section to learn more about the Understanding the Strategy Components.
Understanding the Strategy Components
In this section, we delve into the key components of the trading strategy, focusing on the moving averages and the parabolic SAR.
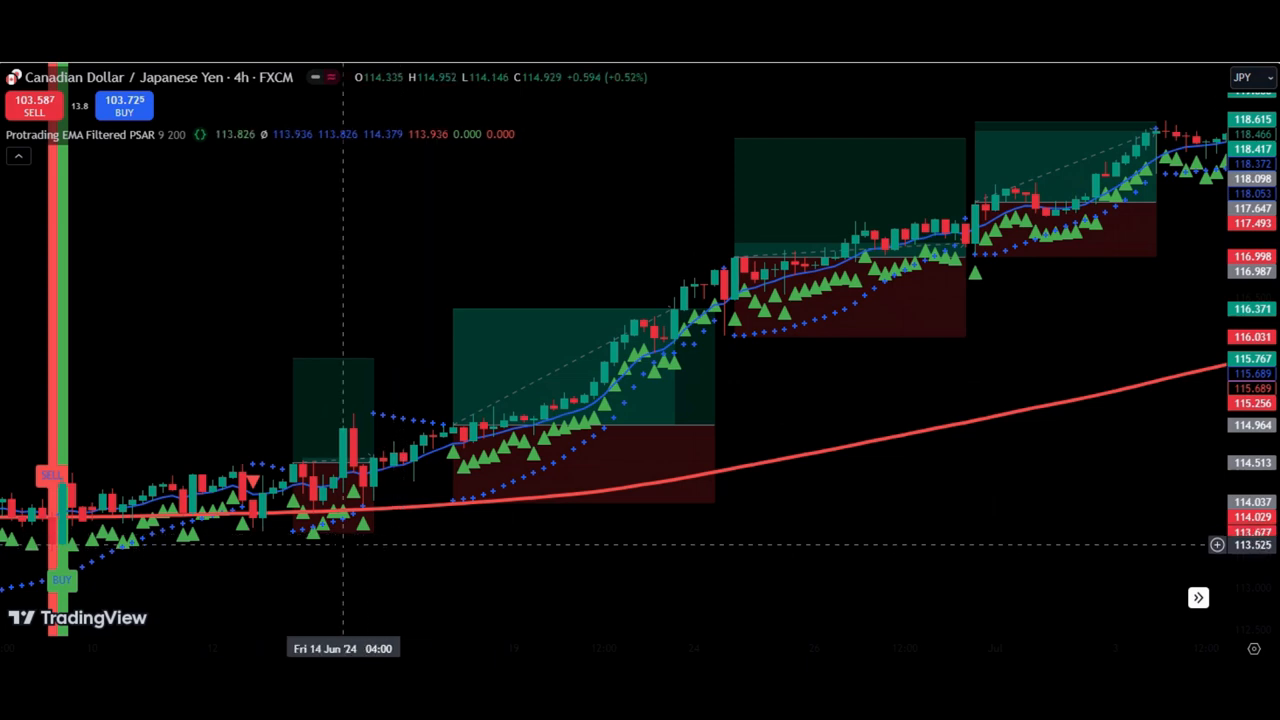
The 200-Day Moving Average
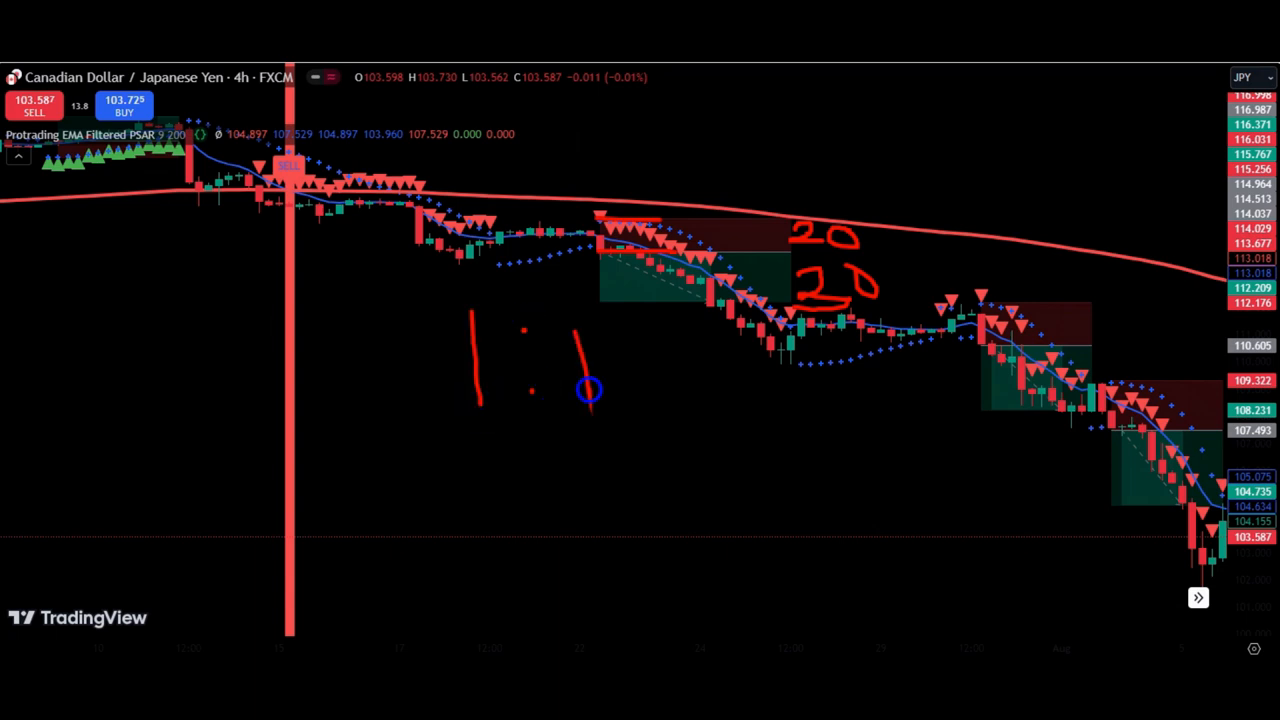
The red line on the chart represents the 200-day moving average. This indicator is crucial for understanding the overall trend direction. It helps traders identify whether the market is in an uptrend or a downtrend.
“The red indicator which you see, the red color is the two hundred day moving average.”
The 9-Day Exponential Moving Average
The 9-day exponential moving average (EMA) plays a pivotal role in this strategy. When the 9-day EMA crosses the 200-day moving average, it signals a change in trend direction. A cross from below to above indicates a shift to an uptrend, while a cross from above to below signals a downtrend.
Identifying Trend Direction
The crossing of these moving averages provides a clear indication of market direction. For instance, when the 9-day EMA crosses above the 200-day moving average, it suggests a buying opportunity as the market enters an uptrend. Conversely, a cross below indicates a selling opportunity as the market shifts to a downtrend.
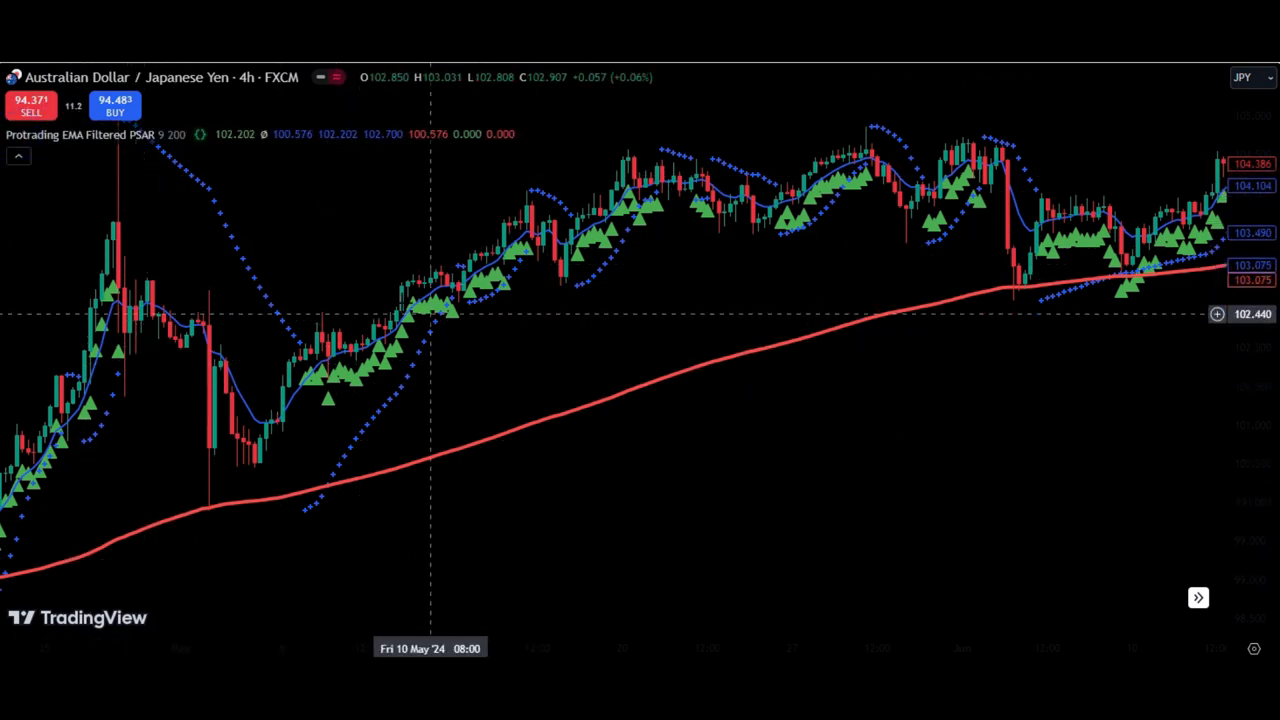
Importance of the Parabolic SAR
The parabolic SAR (Stop and Reverse) is another component that aids in identifying potential entry and exit points in the market. It complements the moving averages by providing additional confirmation of trend direction.
By understanding these components, traders can make informed decisions and align their strategies with the prevailing market trends. For more details on executing trades with this strategy, proceed to the next section: Executing Trades with the Strategy.
So now let’s see how we trade using this strategy.
Executing Trades with the Strategy
In this section, we will explore how to execute trades using the strategy effectively. Follow these step-by-step instructions to ensure successful trading.
Step 1: Determine the Trend
- Identify the Trend: Use the 200-day moving average to determine the market trend. If the price is above the moving average, the market is in an uptrend.
Step 2: Use Parabolic SAR for Signals
- Wait for a Signal: Look for the first signal from the Parabolic SAR after confirming the trend. Do not take trades at the confirmation point.
- Open a Trade: Once a new signal is generated by the Parabolic SAR, open a buy trade at the close of the candle.
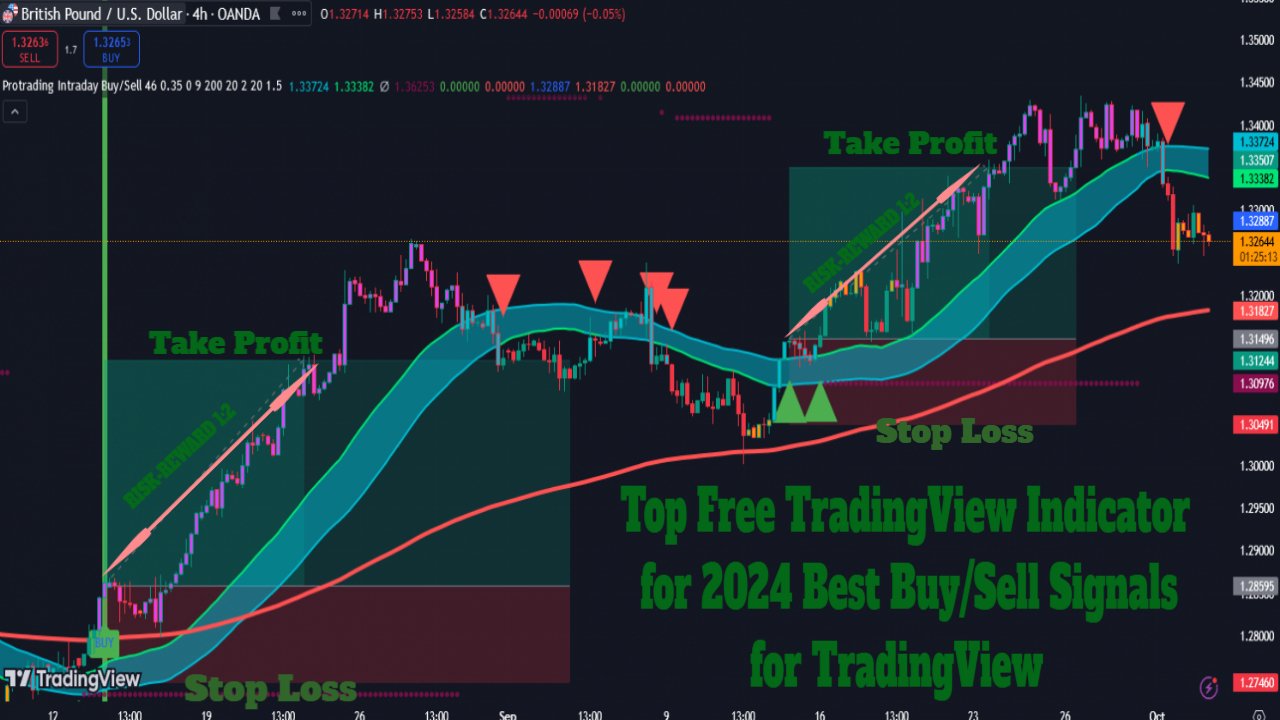
Step 3: Set Stop Loss and Take Profit
- Stop Loss: Place the stop loss at the Parabolic SAR level.
- Take Profit: Set the take profit at 1.5 times the risk. For example, if risking 10 pips, target 15 pips.
Step 4: Manage the Trade
- Trail the Stop Loss: Use the Parabolic SAR to trail the stop loss as the trade moves in your favor.
- Exit the Trade: Exit when the take profit is hit or when the Parabolic SAR gives an opposite signal.
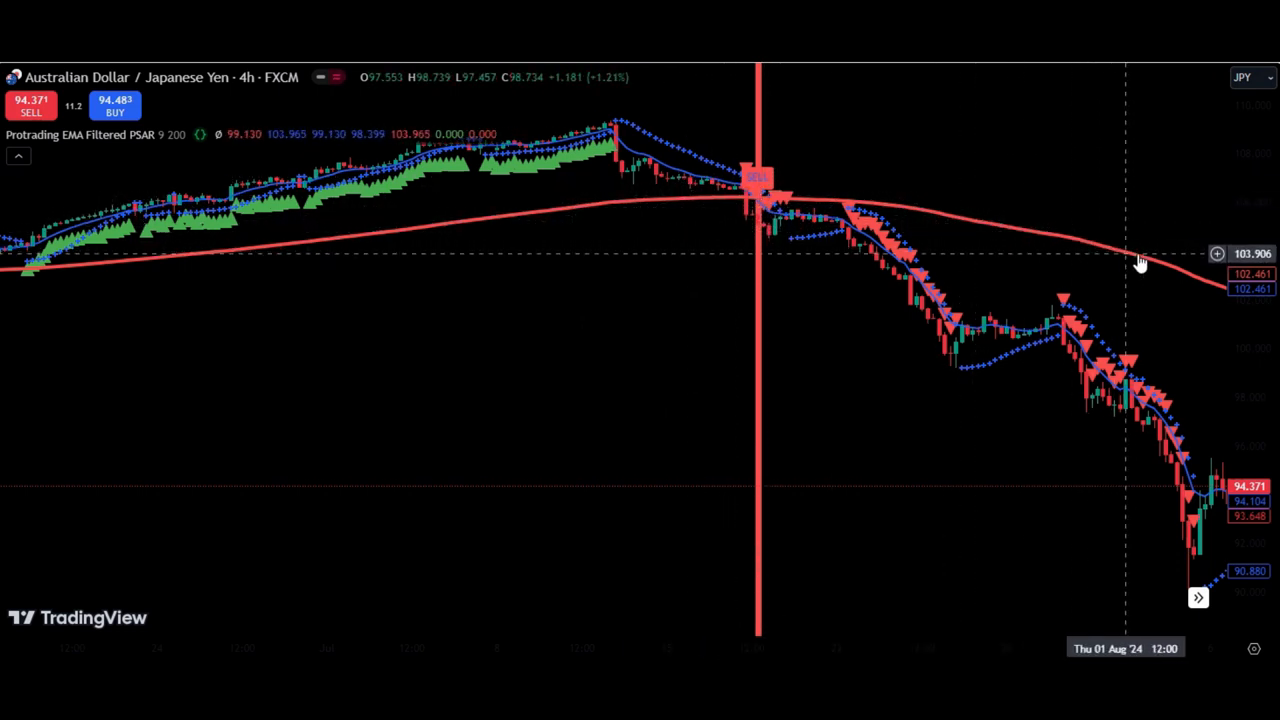
Step 5: Execute Sell Trades
- Change in Bias: When the Parabolic SAR indicates a change from upward to downward, look for sell opportunities.
- Open a Sell Trade: At the close of the candle with a new Parabolic SAR signal, open a sell trade and place the stop loss at the Parabolic SAR level.
- Target and Trail: Set the target at 1.5 times the risk and trail the stop loss using the Parabolic SAR.
By following these steps, you can effectively execute trades using this strategy, ensuring that you manage risk and maximize potential profits.
In conclusion, this trading strategy offers a straightforward approach to making profitable trades in the market. By following the signals and setting appropriate stop losses and take profits, traders can effectively utilize this method on a four-hour time frame. The strategy is designed to be simple and accessible, ensuring that even those new to trading can benefit.
We encourage you to try out this strategy and share your experiences. Your feedback is invaluable, and we invite you to leave comments or questions below. We are here to assist you with any concerns or guidance you may need.
I wish you happy trading.
[…] Key Features of Our Stock Trader Risk Assessment Tool […]