Unlock the secrets of successful crypto trading with this in-depth guide on mastering the art of reading technical analysis charts.
 Image courtesy of AlphaTradeZone via
 Table of Contents
As a cryptocurrency trader, understanding technical analysis charts is crucial for making informed decisions and maximizing profits. In this guide, we will delve into the world of technical analysis charts and explore how you can master the art of reading and interpreting them.
How to Read and Interpret Technical Analysis Charts
Overview of Technical Analysis Charts
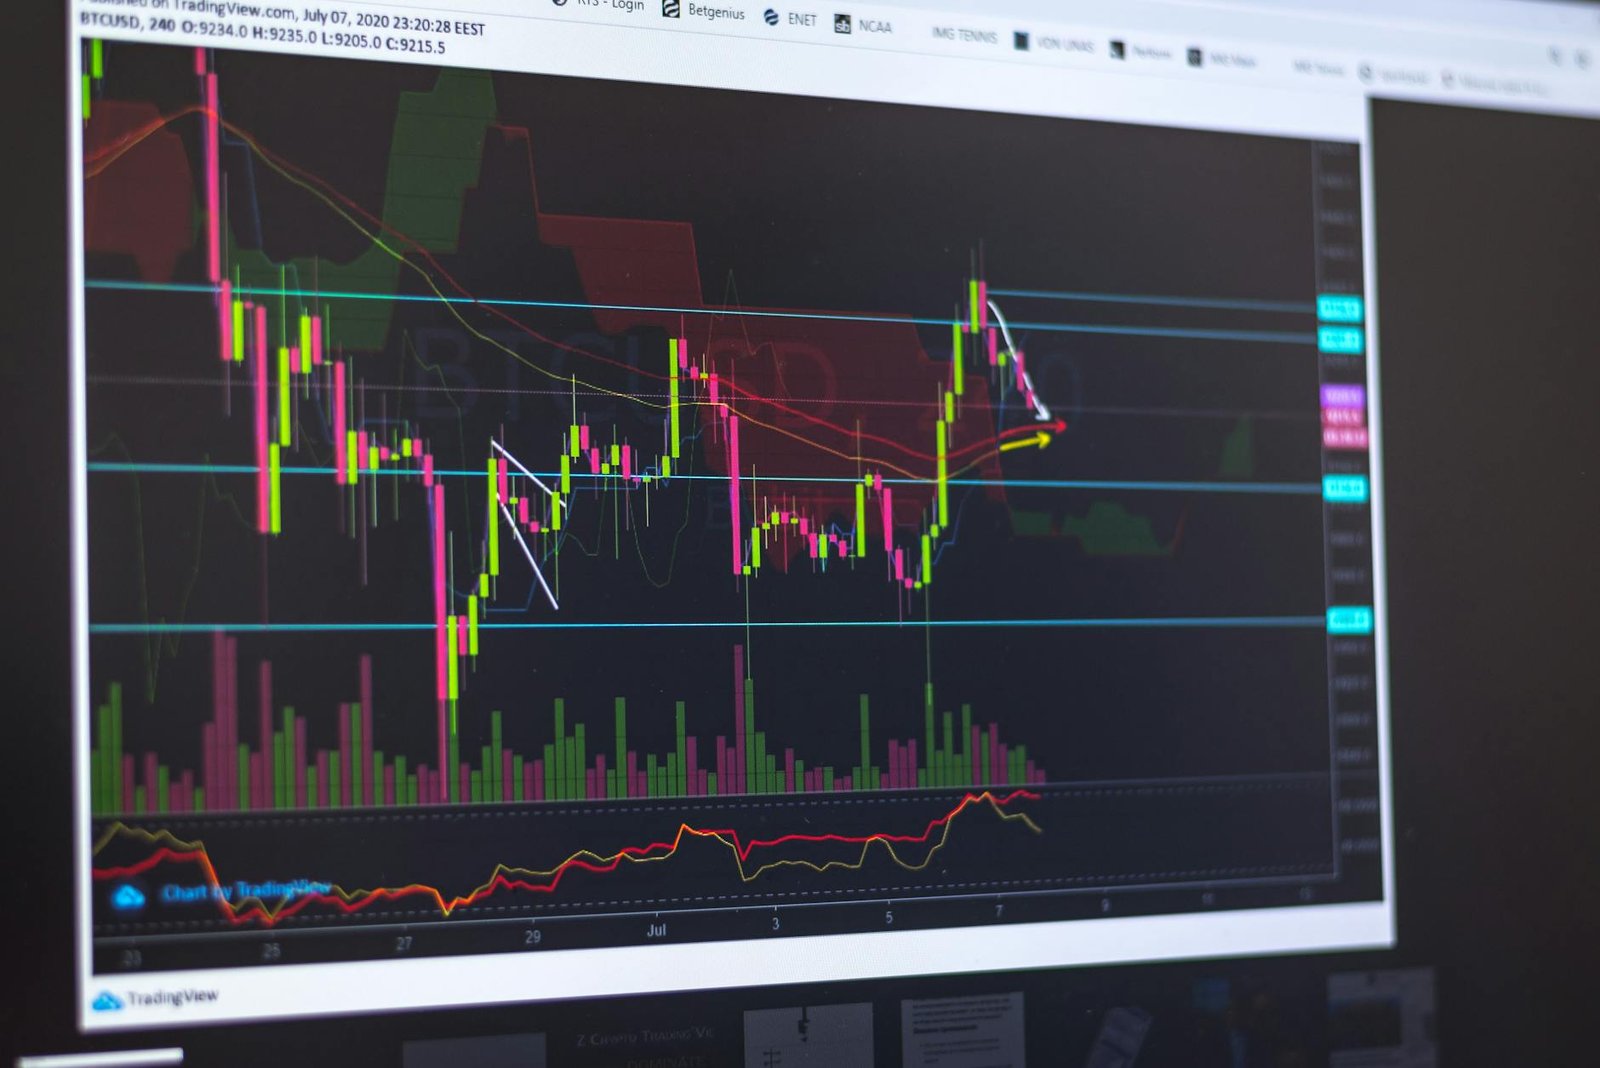
Technical analysis charts are graphical representations of historical price movements of a particular cryptocurrency. They help traders identify patterns, trends, and potential price movements based on past data. Common types of technical analysis charts include line charts, candlestick charts, and bar charts.
Types of Technical Analysis Charts
1. Line Charts:
Line charts are simple and easy to read, displaying the closing price of a cryptocurrency over a specific period. They provide a quick overview of price trends but may lack detailed information compared to other chart types.
2. Candlestick Charts:
Candlestick charts offer more in-depth information, including opening and closing prices, as well as high and low prices within a specific timeframe. Different candlestick patterns signify bullish or bearish market sentiment.
3. Bar Charts:
Bar charts display price movements using vertical lines to represent price ranges during a set period. They provide information on opening, closing, high, and low prices, allowing traders to analyze price volatility.
Interpreting Technical Analysis Charts
When interpreting technical analysis charts, consider the following key elements:
1. Support and Resistance Levels:
Support levels indicate a price point where the cryptocurrency is expected to find buyers, preventing it from falling further. Resistance levels, on the other hand, represent a price point where selling pressure may increase, causing the price to drop.
2. Trends:
Trendlines help traders identify the direction in which a cryptocurrency’s price is moving. Uptrends indicate bullish market sentiment, while downtrends suggest bearish sentiment.
3. Chart Patterns:
Chart patterns such as head and shoulders, triangles, and wedges can provide insights into potential price movements. Recognizing these patterns can help traders predict future price trends.
Using Technical Analysis Charts in Crypto Trading
Technical analysis charts play a crucial role in guiding trading decisions in the cryptocurrency market. They can help traders:
| Topic | Description |
|---|---|
| Overview of Technical Analysis | This section covers the basics of technical analysis, including its purpose and main concepts. |
| Candlestick Charts | Learn how to interpret candlestick charts to identify trends and patterns in crypto trading. |
| Support and Resistance Levels | Understand the significance of support and resistance levels in analyzing price movements. |
| Moving Averages | Discover how moving averages can help traders identify trends and make informed decisions. |
| Relative Strength Index (RSI) | Learn how to use the RSI indicator to gauge the strength of a trend and spot potential reversals. |
| MACD Indicator | Explore how the MACD indicator can help traders identify changes in trend momentum. |
1. Identify Entry and Exit Points:
By analyzing chart patterns and support/resistance levels, traders can determine optimal entry and exit points for their trades.
2. Manage Risk:
Technical analysis charts enable traders to set stop-loss orders and take-profit levels based on key price levels, helping manage risk effectively.
3. Confirm Trade Signals:
Charts can confirm trade signals generated by other technical indicators, providing additional validation for trading decisions.
Conclusion
Every day 87,122 people use this Bizarre “Tap Water Ritual” To Rapidly Dissolve Fat
Are You Struggling to Lose Weight, See this Simple Solution!
Mastering the art of reading and interpreting technical analysis charts is essential for success in crypto trading. By understanding the different types of charts, interpreting key elements, and using them effectively in your trading strategy, you can make informed decisions and optimize your trading performance. Stay tuned for more insights and tips on navigating the exciting world of cryptocurrency trading!
How can I improve my skills in interpreting technical analysis charts?
Practice regularly by analyzing historical price data, attending trading workshops, and seeking mentorship from experienced traders.
Are technical analysis charts accurate in predicting cryptocurrency price movements?
While technical analysis charts provide valuable insights, they should be used in conjunction with other indicators for more accurate predictions.
How often should I update my technical analysis charts for crypto trading?
It’s recommended to update your charts regularly, depending on your trading strategy and the timeframe you’re focusing on.
What are some common mistakes to avoid when interpreting technical analysis charts?
Avoid overcomplicating your analysis, ignoring key support/resistance levels, relying solely on one indicator, and failing to adapt to changing market conditions.
[…] Best trading analytics platform for beginners […]